
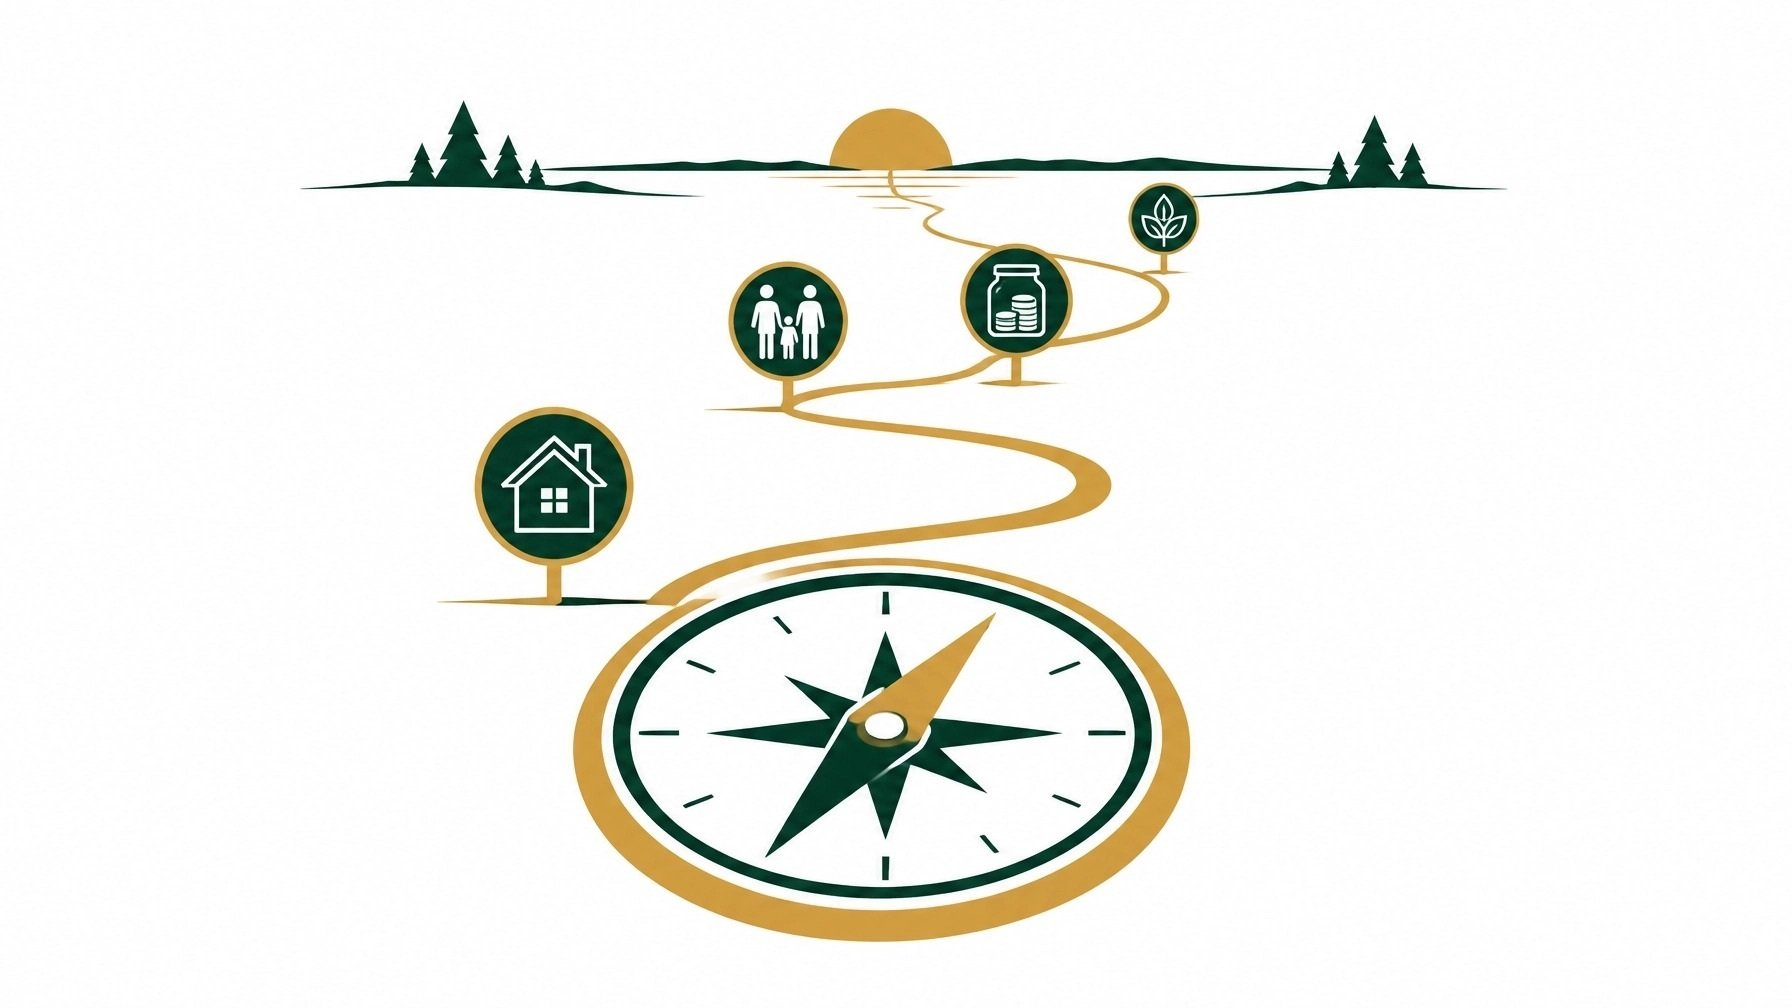
What if your Financial Independence Number was not a finish line?
What if it was simply a compass bearing? A way to check whether your financial decisions are generally taking you where you want to go?
That is the more useful way to think about it.
Your number is not a verdict on your life. It does not tell you whether you are “ahead” or “behind.” It is not a reason to compare your household with someone else’s household. Used properly, it gives you direction, context and a calmer way to measure progress.
For Alberta working families, contractors, middle-income households and people without workplace
pensions, that clarity can be valuable.
You do not need a perfect plan.
You need a direction, and a simple annual check-in.
What Is the Financial Independence Number?
In plain English, your Financial Independence Number is an estimate of the assets you may need to support your desired lifestyle without relying entirely on employment income.
It can be influenced by:
• Your expected retirement age
• Your desired income and spending
• Your savings and investments
• Your mortgage and other debts
• Your health and family responsibilities
• Government benefits such as CPP and OAS
• Workplace pensions or other future income
• Your comfort with investment risk and your timeline
A broad educational rule of thumb sometimes places the number at 10 to 20 times annual income.
That can be a useful starting point, but it is not a personal answer. Your actual number depends on
your circumstances.
This article is not about calculating the number again. It is about using it as an annual measurement
tool.
That difference matters.
The Better Question Is: Are You Moving in the Right Direction?
Most people focus on the total gap.
“I still need $800,000.”
That number can feel overwhelming, especially when you are also managing a mortgage, childcare,
vehicle costs, groceries or unpredictable contractor income.
A more helpful question is:
What changed since last year?
Once a year, look at three numbers:
1. Your net worth
2. Your annual savings rate
3. Your remaining gap, and whether it is moving
The direction of travel often matters more than the distance remaining.
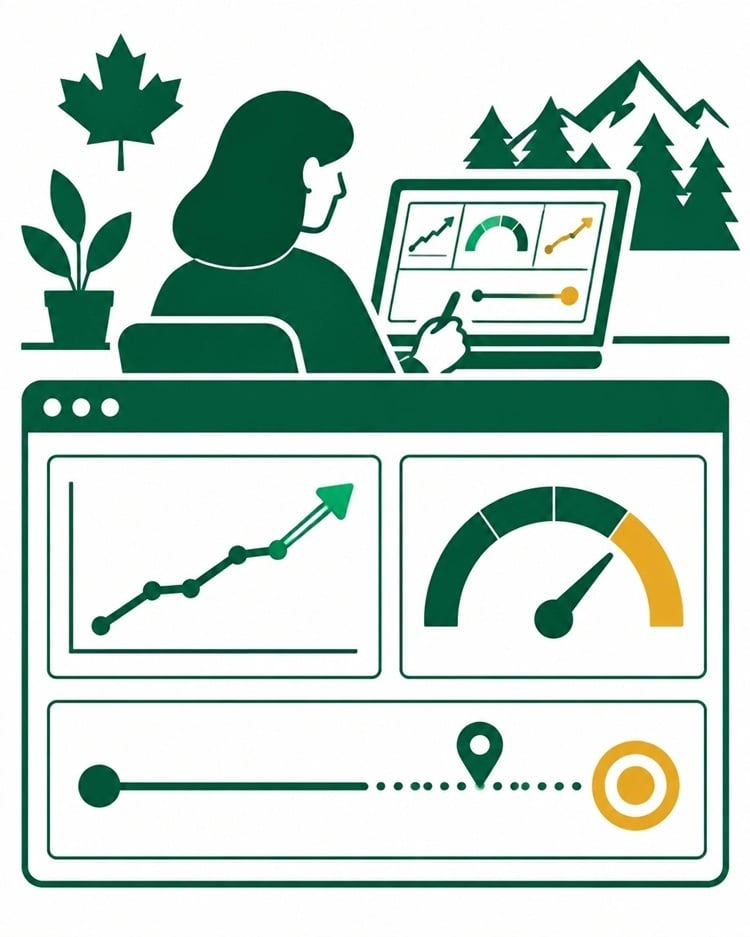
1. Net Worth: What You Own Minus What You Owe
Your net worth is a simple snapshot:
Assets – liabilities = net worth
Assets may include:
• Savings accounts
• TFSAs and RRSPs
• Investments
• Home equity
• Business assets
• Other property
Liabilities may include:
• A mortgage
• Lines of credit
• Credit card balances
• Vehicle loans
• Business debt
Your net worth will not rise every year. Markets change. Homes change in value. Major family expenses
happen. A year with a flat or lower net worth is not automatically a failure.
The purpose is to notice the longer pattern.
Are debts gradually falling? Are savings gradually increasing? Are you building more flexibility into
your life?
2. Savings Rate: What Percentage of Income Did You Keep?
Your savings rate measures how much of your income you actually saved or invested.
For example, if your household earns $60,000 and saves $6,000 during the year, your savings rate is approximately 10%.
This number can be more useful than a dollar amount because it adjusts for income. It helps you see whether your habits are changing, even when your income changes.
For contractors and self-employed Albertans, you may calculate this using annual income rather than one unusually strong or weak month.
3. Your Gap: How Far Away, and Is It Changing?
Your gap is the difference between your current financial position and your estimated Financial Independence Number.
But do not look only at the size of the gap. Ask what is influencing it:
• Did your savings increase?
• Did your debt decline?
• Did your income change?
• Did your retirement timing change?
• Did your expected spending change?
• Did your estimate become more realistic?
Your number is an estimate based on assumptions. It can move because your actions change, but it
can also move because your life changes.
That is normal.
Why Savings Rate Is Often the Strongest Lever
Income matters. But income alone does not determine progress.
Consider this simple illustration:
| Household | Annual Income | Savings Rate | Annual Amount Saved | Ten-year Contributions Before Growth |
| Household A | $60,000 | 20% | $12,000 | $120,000 |
| Household B | $120,000 | 5% | $6,000 | $60,000 |
This is an illustration, not a projection. It assumes the same income and savings pattern every year, ignores investment returns, taxes and inflation, and does not promise any outcome.
The point is simply that Household A earns less but saves more each year. Over ten years, the household has directed twice as much toward its future under these assumptions.
Now consider another comparison:
• A $60,000 household saving 16% sets aside $9,600.
• A $120,000 household saving 8% also sets aside $9,600.
The incomes are very different. The annual savings are the same.
This is why your savings rate deserves attention. You may not be able to double your income this year. You may be able to redirect an extra $25, $100, or $250 each month.
Small changes count.
Four Things That Move Your Number Most
1. Your Savings Rate
The amount you consistently save affects how quickly your assets may grow. A higher savings rate generally gives you more room to handle career changes, family needs and future retirement income.
The right rate is not universal. It depends on your income, debt, dependents and other responsibilities.
2. The Number of Years You Stay Invested
Time gives your savings more opportunity to participate in market growth. Starting earlier can help because you have more years to contribute and adjust.
That does not mean investment returns are guaranteed. They are not.
It means time may give you more flexibility than trying to make up for lost years through aggressive decisions later.
3. Debt Costs That Compete With Saving
High-interest debt can absorb money that might otherwise go toward savings.
A household paying interest on credit cards, personal loans or a high-cost line of credit may need to balance debt reduction with investing. There is no one-size-fits-all answer, but your annual review should show whether expensive debt is shrinking, growing or staying the same.
4. The Age at Which You Start Drawing Income
The age when you begin using your savings affects how long those savings may need to support you.
Starting withdrawals earlier may require more personal assets. Working longer, spending less, or receiving government benefits later may change the amount you need to provide from your own accounts. This is one reason why retirement planning in Alberta should consider income sources together rather than treating a single account in isolation.
Government Benefits Can Reduce the Personal Gap
CPP and OAS may cover part of the income you need in retirement. That means your personal Financial Independence Number may be smaller than your gross spending target suggests.
But avoid assuming you will receive the maximum.
For 2026:
• CPP can begin between ages 60 and 70.
• Starting at 60 means a 36% reduction compared with starting at 65.
• Starting at 70 means a 42% increase compared with starting at 65.
• The maximum CPP retirement pension at age 65 is $1,507.65 per month.
• The average CPP pension for new age-65 beneficiaries was reported at $877.01 per month earlier in 2026. Official averages can vary by quarter.
• The maximum OAS amounts for October to December 2026 are approximately $762.50 per month for ages 65 to 74 and $838.75 for ages 75 and over.
Your actual amounts depend on your contribution history, income, residency and eligibility. You can review your personal CPP estimate through My Service Canada Account.
Government benefits may help. Your personal number still matters because your household may need to fund the difference.
For official information, review the Government of Canada’s CPP payment amounts and OAS payment amounts.
The Number Looks Different for Every Household
A dual-income family with a mortgage
Two incomes may provide stability, but a mortgage and children’s expenses can reduce the amount available for long-term saving. Their review may focus on balancing mortgage payments, emergency savings, education goals and retirement contributions.
A single-income household
A single-income household may have less room for regular contributions and may need to place greater emphasis on emergency savings, income protection and realistic spending expectations.
A contractor with fluctuating income and no workplace pension
A contractor may save more during strong months and less during slow periods. Their annual review may focus on the full-year savings rate, tax planning conversations with an accountant, emergency reserves and building retirement assets without an employer pension.
None of these households is automatically doing better or worse.
Their numbers are simply different.
A One-Hour Annual Review Routine
Choose one date every year. It might be your birthday, the first weekend of January, or the anniversary of starting your plan.
Gather three figures:
1. Your total assets and liabilities
2. Your total savings and investments for the year
3. Your updated estimate of the gap
Then compare them with the previous year.
Ask:
• What improved?
• What became more difficult?
• Did my income or family responsibilities change?
• Is one debt costing more than expected?
• What is one adjustment I can make over the next 12 months?
You do not need to redesign your entire life in one sitting.
Choose one practical action.
| What to Track | What it Tells You | What Usually Moves It |
| Net worth | Your overall financial position | Saving, debt reduction, asset values |
| Savings rate | How much income you kept | Automatic contributions, spending changes, income changes |
| Gap to your number | Your estimated remaining distance | Savings, debt, retirement timing, income needs |
| Debt balance | Whether interest is competing with progress | Repayment plan, refinancing review, lower borrowing |
| Government benefit estimates | How much income may come from public programs | Contribution history, claiming age, eligibility |
What If the Gap Looks Too Large?
Start with the next 12 months.
Do not try to emotionally carry the entire number every day. Your job is not to solve thirty years of retirement planning this afternoon.
Your job may be to:
• Increase an automatic contribution by $25 per month
• Review one high-interest debt
• Build a small emergency reserve
• Check your CPP estimate
• Revisit your retirement age
• Track your savings rate more accurately
• Ask a question you have been postponing
Progress is often quiet.
It looks like a balance that is slightly higher, a debt that is slightly lower, or a decision that is finally clear.
That is still progress.
A Practical Next Step
If you would like help reviewing your Financial Independence Number as an annual measurement, not as a judgment, we invite you to start with a conversation.
You do not need a perfect plan, substantial savings, or all the answers. Bring your questions and doubts. We can look at your income, debts, savings, insurance, retirement goals, and changing responsibilities together, in plain language and at your pace.
Website: https://www.jkassetmanagement.ca/index
Phone: (780) 399-5471
Email: kapler@jkassetmanagement.ca
Contact page: https://www.jkassetmanagement.ca/contact
No Family Left Behind.
Educational disclaimer: This article is for general information only and is not investment, tax, legal, or retirement-income advice. The examples are illustrations and do not guarantee returns or outcomes. Government benefit amounts and eligibility rules may change. Your personal situation should be reviewed before making financial decisions.